 |
|||||||||||||||||||||||||||||||||||||||||||||||||||||||||||||||||||||||||||||||||||||||||||||||||||||||||||||||||||||||||||||||
Flu Across the MapFlu Survey: flu index | flu facts | school month | map | time line warper | remedies |
|||||||||||||||||||||||||||||||||||||||||||||||||||||||||||||||||||||||||||||||||||||||||||||||||||||||||||||||||||||||||||||||
|
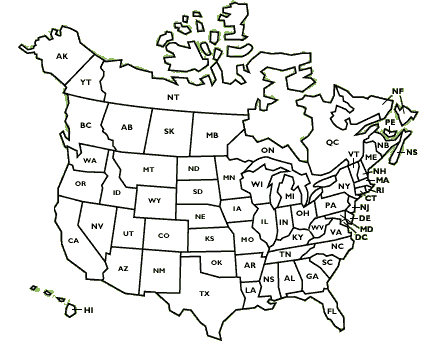
On average, ZOOMers who took part in the ZOOMflu survey missed 4 days of school from the flu. Do you think ZOOMers in one region missed more school when they got the flu than ZOOMers in other regions? Use our Flu got you where? map to get the answers. |
|||||||||||||||||||||||||||||||||||||||||||||||||||||||||||||||||||||||||||||||||||||||||||||||||||||||||||||||||||||||||||||||
 |
|||||||||||||||||||||||||||||||||||||||||||||||||||||||||||||||||||||||||||||||||||||||||||||||||||||||||||||||||||||||||||||||
|
Average Number of School Days Missed (United States and Canada)
1. Here's how to graph the data. Print this page so that you can draw on the graph. 2. Get six colored pencils or crayons to match each color in the "Average Number of School Days Missed" color scale. Each state's average matches a color. Purple is the least amount of days missed and red is the most. So, if a state averaged 1 day missed, you'd color it in purple. If a state averaged 3 days missed, you'd color it in green. Find your state's average and color it in on the map. How does it compare to the national average of 4 days missed? 3. Next, find the averages for the states around your state and color them in on the map. How does your state compare to the states around it? 4. Keep coloring in every state until you're done. What do you see? Do you notice any patterns in different regions? Did ZOOMers in one region miss more school on average than ZOOMers in other regions? Why do you think that is? |
|||||||||||||||||||||||||||||||||||||||||||||||||||||||||||||||||||||||||||||||||||||||||||||||||||||||||||||||||||||||||||||||
 |
|||||||||||||||||||||||||||||||||||||||||||||||||||||||||||||||||||||||||||||||||||||||||||||||||||||||||||||||||||||||||||||||
not yet implemented


